App
Smartphone app
The app and web interface are a tool for initial system initialization, system configuration, and subsequent monitoring. Web interface works with almost any modern browser and on smartphones with iOS & Android
Subscription
extending system functionality with an annual subscription
extending system functionality with an annual subscription
Initial system setup
used to register, start and configure the system by users
used to register, start and configure the system by users
Viewing the archive of events and graphs
provides access to data for the entire time of using the system 24/7
provides access to data for the entire time of using the system 24/7
PUSH notifications
instant notification of the current change of specified parameters
instant notification of the current change of specified parameters
Apiary map (under development)
ability to view your personal apiaries on a map
ability to view your personal apiaries on a map
Provides real-time information collected by the system at the apiary
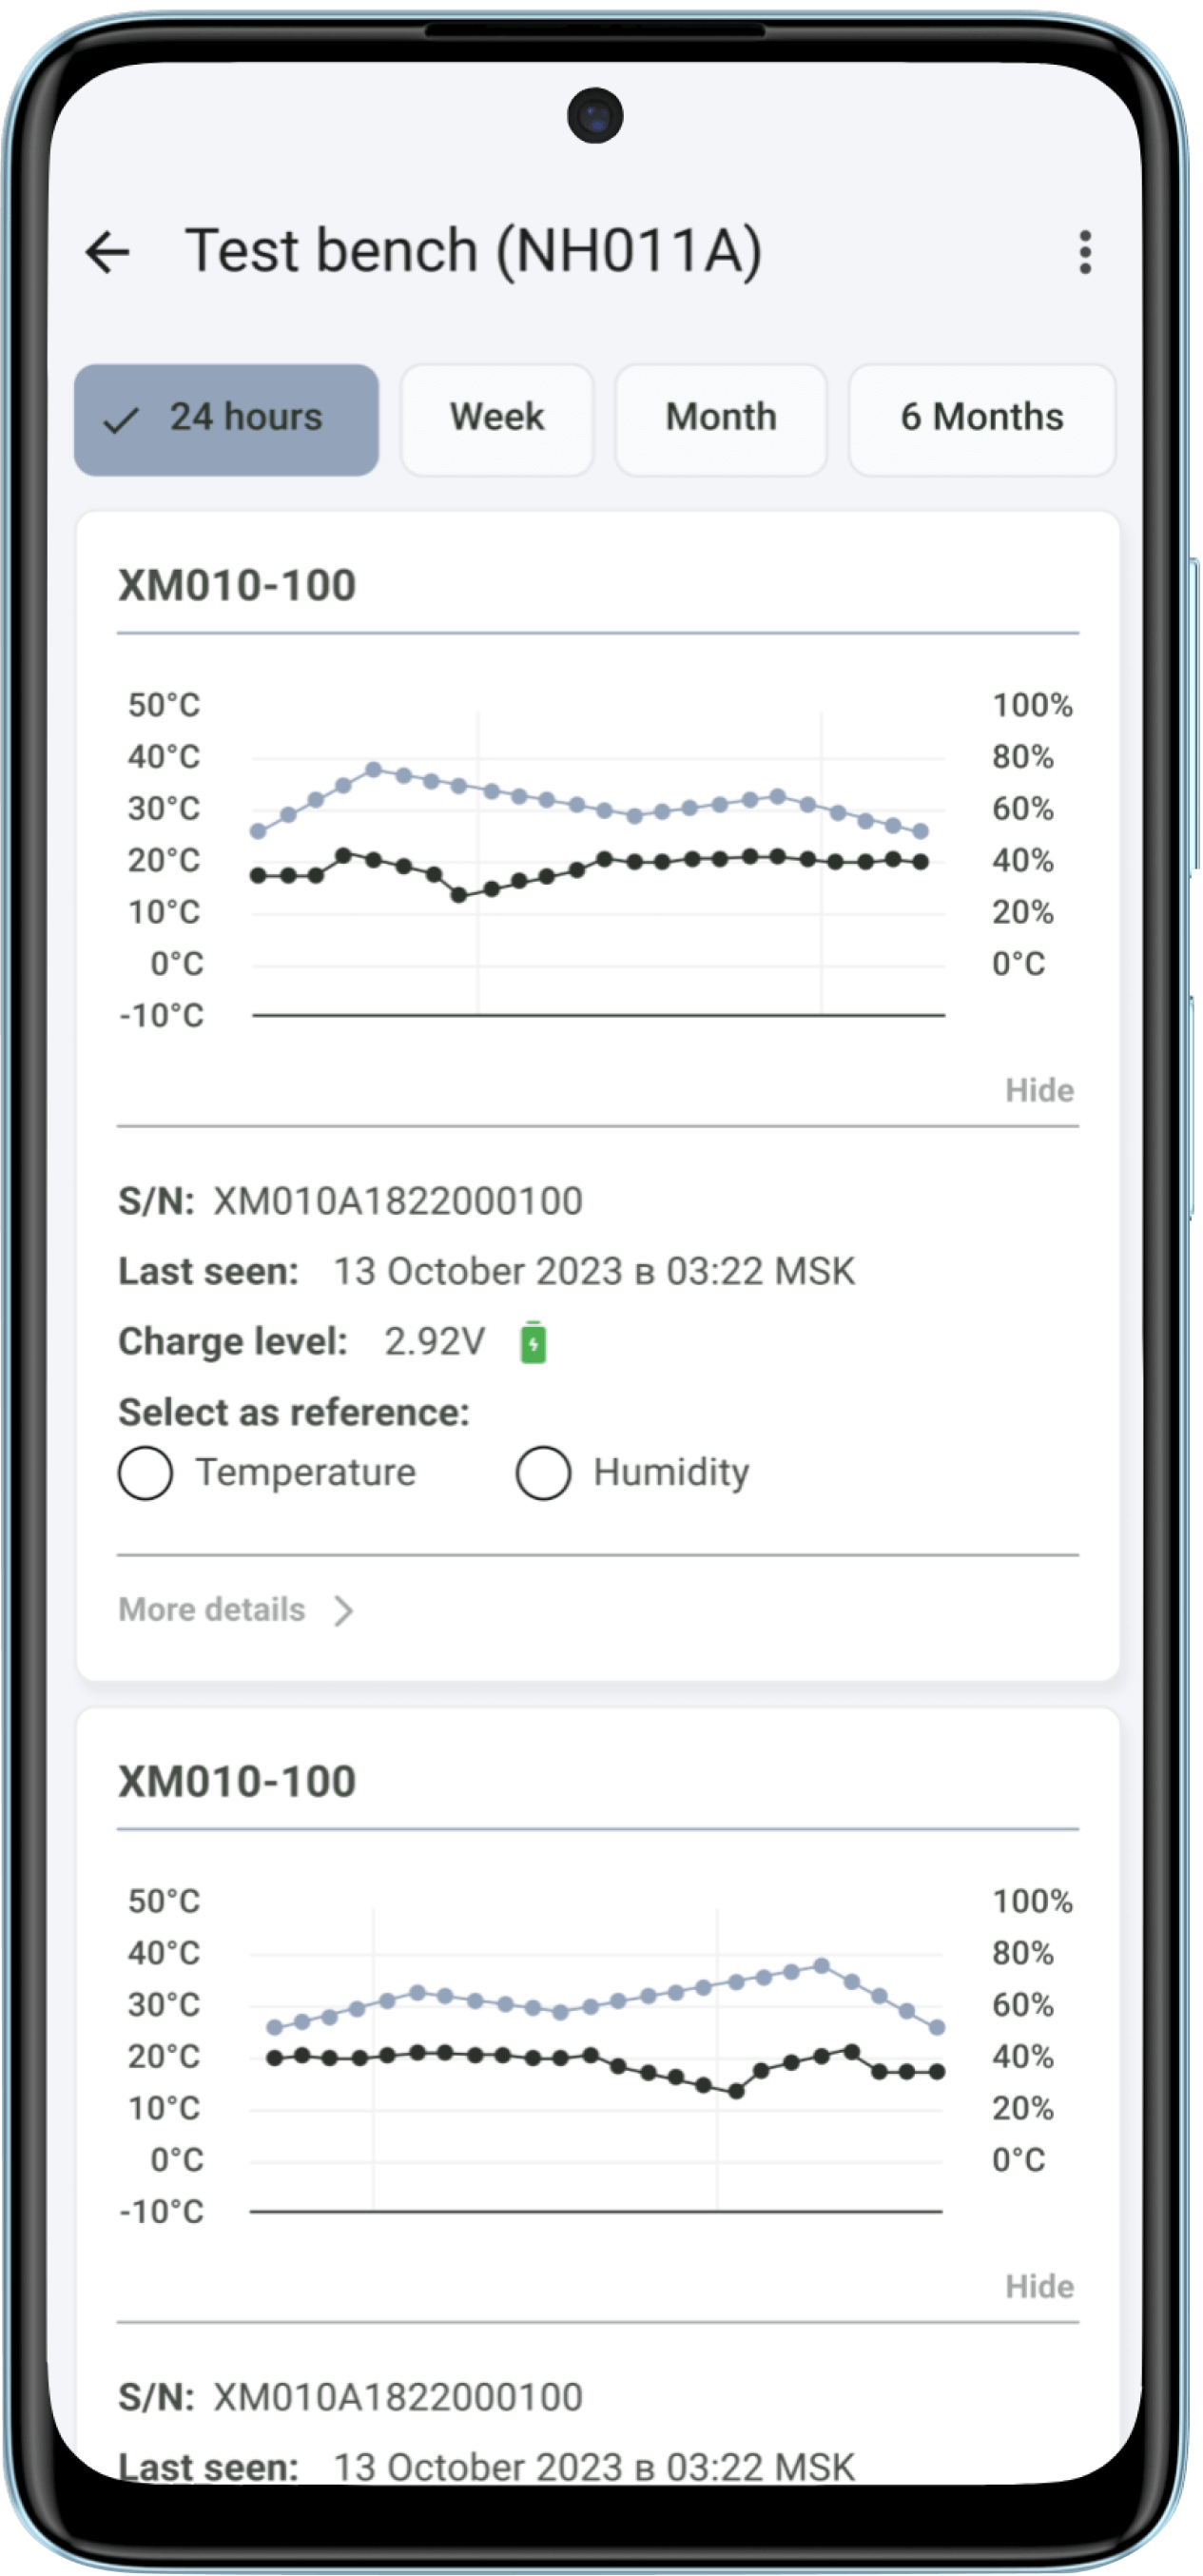
Humidity and temperature are shown in one graph
4 selected sound frequencies in one chart
Audio player for playback of 10-second recordings
Hive weight and daily weight gain graph
QR code scanning for quick access to hive data
Side by side graph comparison
Adjustment of the weight gain calculation time
Variable scale of data presentation and selection of any date
Quick addition of brand new sensors and removal of old ones
Renaming hives and grouping them
Downloads
Get a free demo access to the The Bee Army app and see how it works
Simply fill out the form below with your contact information and we will send you temporary credentials for demo access and instructions.


